Creative Benchmarks by Motion
Creative Benchmarks Calculator
See where you stand next to the best advertisers in your niche.


See where you stand next to the best advertisers in your niche.
Your monthly ad spend tier
Health & Wellness Industry
How brands in your spend tier perform across the Health & Wellness industry.
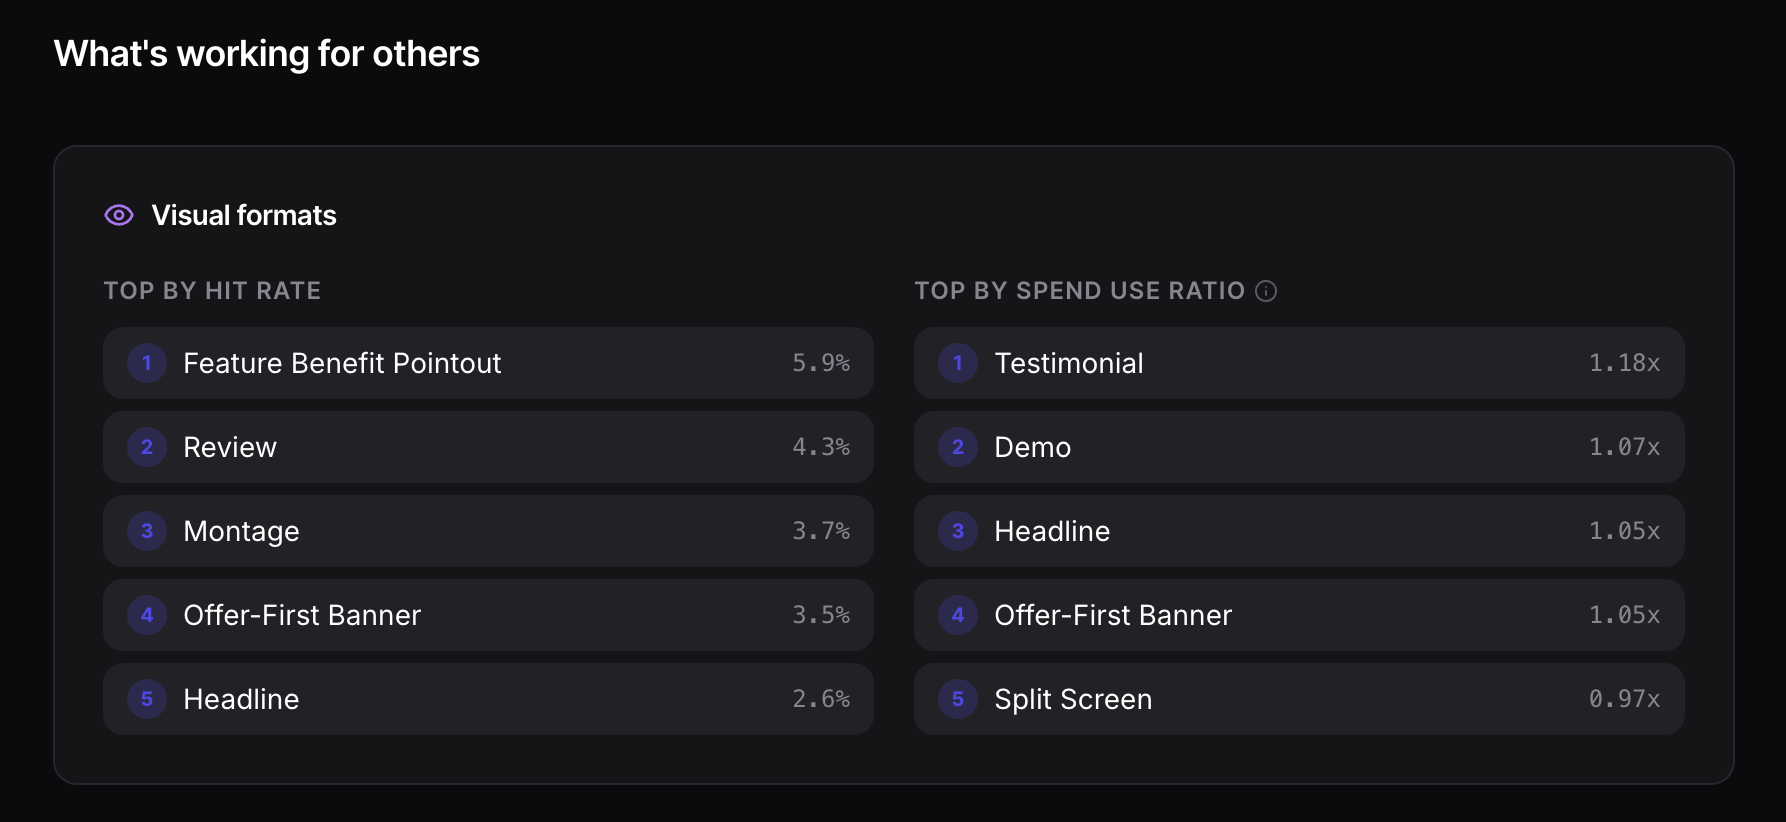
Leaderboards
Top-performing formats, assets and hooks in your tier — ranked by hit rate.
68 visual formats
See real ad examples for each format
Interactive
How many creatives do you need to launch per week to likely hit a winner?
Strategy
What the data consistently tells us about how winning ads actually happen.
1. Winners are statistically rare
Most ads will not become winners. That is normal behavior in this system, not proof of weak strategy.
2. Volume creates opportunity
Higher output does not guarantee each ad is better. It increases your chances of discovering outliers that scale.
3. Format performance is contextual
The same format can perform differently by vertical, scale, timing, and saturation. Universal "best format" lists are misleading.